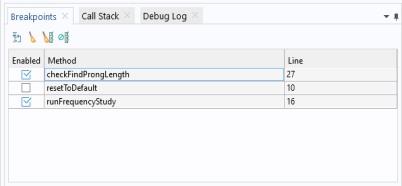
The Breakpoints window contains a list of all breakpoints in all methods in the application. You can open this window by clicking the
Breakpoints button (

) from the
Method ribbon tab or from the
Windows menu on the
Home ribbon tab.
The table includes all breakpoints and contains the following columns: Enabled, where you can select and clear the check box to enable and disable a breakpoint;
Method, which shows the name of the method where the breakpoint has been added; and
Line, which shows the line in the method where the breakpoint has been set.
In the toolbar above the table, click the Go to Line button (

) to move to the line for the selected breakpoint in a method editor window (which opens automatically if needed). Click the
Remove button (

) to remove the selected breakpoint. Click the
Remove All (

) to remove all breakpoints. Click the
Disable All (

) button to disable all breakpoints. Click the
Disable All button again to enable the disabled breakpoints.